

From its earliest applications, electrical tomography has proven to be extremely proficient at detecting the component parts and aliquot divisions of a multi-phase flow by using either electrical resistance tomography (ERT), electrical capacitance tomography (ECT), or through a combination of the two.
As ITS is celebrating its 25th anniversary this year, it is appropriate to take a look at a paper co-authored by Professor Mi Wang from the University of Leeds who not only helped to found ITS as a standalone commercial entity, but was also an early pioneer in electrical process tomography.
Published in 1999, and stemming from a joint collaboration between the University of Leeds and The University of Manchester, this paper is an early example of ERT’s proficiency in being able to detect variations, non-uniformity, and density of foam.
Monitoring foam in isolation or as part of a multiphase complex, where observing level is main objective, has been a very common application for ITS during its 25 year history. Widely used in academic research, ITS level detection solutions have been rolled out in chemical manufacturing, FMCG, food & beverage, mineral processing, civilian nuclear plants, pharmaceutical manufacturing, and in the petroleum industry.
In many cases, ITS technology has been used to monitor multiphase flows consisting of many or any of the following combinations: liquid-liquid, liquid-gas, liquid-solid, solid-gas, solid-liquid-gas. Rather than to examine each industrial application in isolation, it is instructive to view a small selection of bench-top demonstrations where ERT’s real-time visualisation capabilities can be confirmed through the reader’s own visual observations. After all, seeing is believing!
Carbon dioxide is a gaseous component common to many alcoholic and non-alcoholic canned beverages. The resulting foam and phase interface between the beverage liquid, foam, and gas is easily detectable using ERT as the video below illustrates.
Monitoring level and phase has obvious applications in chemical manufacturing, FMCG, and many other industries. The video below is another variation on the foam-level detection theme. Using detergent, the video shows ERT’s versatility by being able to provide instantaneous dynamic visualisations of foam, liquid, and gas interfaces. Once again, the accuracy of the ITS system is confirmed visually.
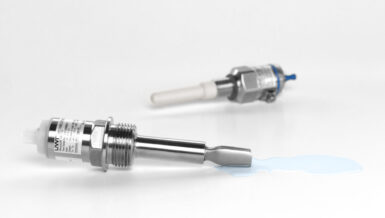
In this demonstration, an ITS linear probe is used in conjunction with an ITS P2+ data acquisition system (DAS). Linear probes can be manufactured to virtually any size depending on the client’s specifications. The P2+ DAS is ideal for research and pilot plant applications as data can be stored for post hoc analysis.
Sand, water, and resulting slurry is another application where ERT has proven to be highly proficient at detecting both level and the interface between constituent media. With obvious relevance to the oil & gas industry, the video below provides a chance to compare ERT’s accuracy and responsiveness with a sand and water mixing application.
ERT’s accuracy can be confirmed visually as sand and water are mixed together to form a slurry. Slurry concentration, and the percentage of sand at the bottom of the vessel, is varied by changing the speed of agitation. ERT proves to be highly accurate and can simultaneously monitor multiple media, including gas/air, simultaneously.
The equipment being used is an ERT linear probe combined with the ITS T4R data acquisition system (DAS). The T4R is a plug-and-play data acquisition system specifically designed for industry and boasts data acquisition speeds of an incredible 600 Hz/600 FPS. Unlike the P2+, the T4R is unable to store data for later analysis but possesses far greater data acquisition speeds as can be seen in the video below.
It is important to note that while these demonstrations all used transparent vessels, they were done so to enable visual confirmation of ERT’s accuracy. This does not rule out ERT being used in an industrial application where a storage vessel might be opaque. ERT provides the wherewithal to, almost literally, see though the walls of a vessel; or to quote the ITS strapline: “See inside your process.”