

Dewpoint’s wide margin of error
Hydrocarbon dewpoint is not measured directly; it is calculated from a chromatographic composition and then modelled by one of several accepted equations of state. Six widely used calculation methods applied to the same pipeline sample have delivered cricondentherm predictions ranging from –92.9 °F (-69.4 °C) to +93.5 °F (+34.2°C) — a swing of 186.4 °F (103.6 °C). Operating envelopes, heater duties and solvent-recovery settings are all tuned to a few degrees of margin. When the “true” dewpoint might be anywhere inside a 100-plus-degree window, operators are effectively flying blind.
Compounding the problem, the sampling standards that underpin dewpoint calculations (API 14.1, ISO 10715) explicitly prohibit two-phase flow. If mist or stratified liquids are already present, the analyser is designed to filter them out, guaranteeing a false-dry reading.
When stratified flows are present, they velocity is much slower than the gas velocity and so it common for the liquid and gas phase not to be in equilibrium (dry gas flowing over liquids). Furthermore, gas phase components are then absorbed into the liquid phase, and this contributes to the large false dewpoint reading calculated from the gas phase components.
What hidden liquids really cost
A liquid volume fraction of just 0.1 % in a 100 million f3/d gas stream equates to more than 10 000 gal./d of natural-gas liquids (NGLs)—millions of dollars in lost product every year. At the point of use, those same entrained droplets foul turbine nozzles, erode turbine blades and compressor seals, overwhelm knock-out drums and filters and shorten catalyst life. Power stations see step-changes in heat-rate and unplanned outages; LNG plants suffer heat exchanger blockages from a few parts-per-billion of heavy hydrocarbons. Every one of these events carries a significant direct cost—maintenance, replacement parts, lost production and an indirect cost in reputation and emissions.
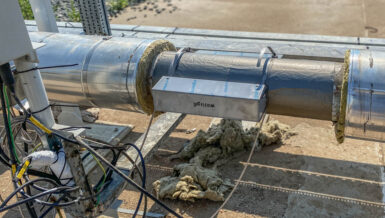
Opening a window into the pipe
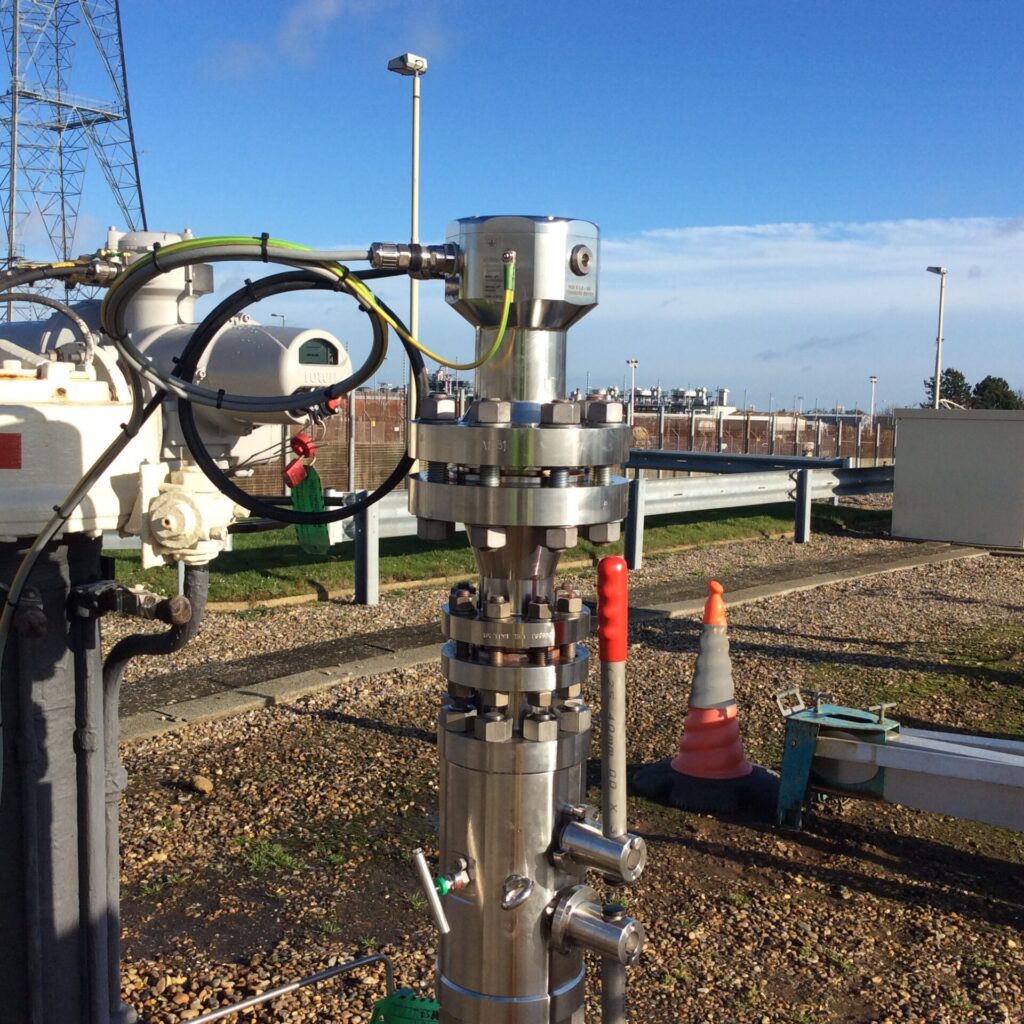
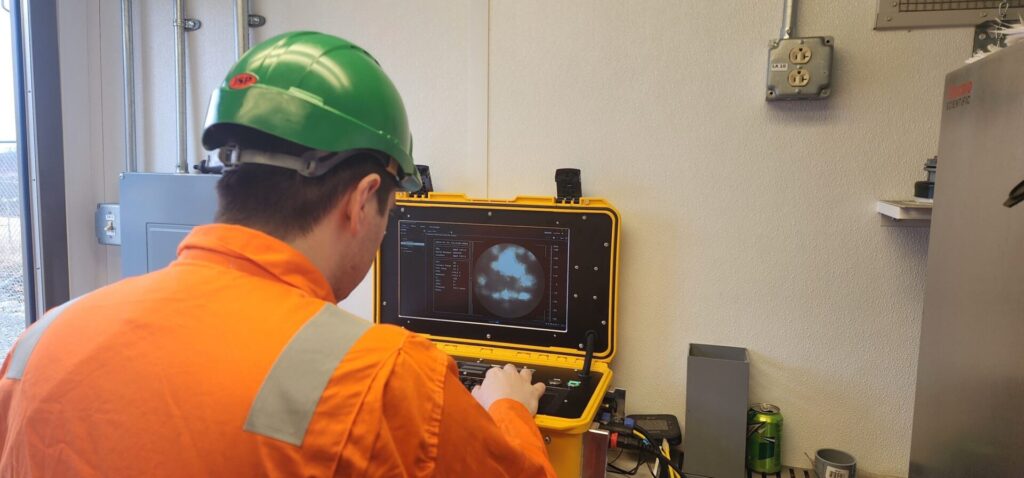
Sixteen years ago, a project led by a major transmission system operator sought to understand why liquid contamination was entering the gas network without triggering alarms with any gas analysis system. This ultimately led to the development of LineVu, an ATEX/IECEx-rated camera installed on a standard tapping point that streams live, high-definition video of the flowing gas. Sixteen years of development, machine-learning image analysis and field hardening have turned that concept into a robust tool that can alarm on mist or stratified flow in real time. In effect, LineVu doesn’t rely on probability, it simply shows what is there.
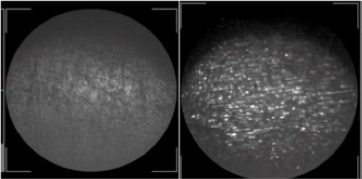
Side-by-side footage from custody-transfer sites on three continents has demolished long-held assumptions. Pipelines certified “dry” by gas chromatograph and dewpoint calculation were filmed carrying heavy mist, streaks of NGLs and even slugs of compressor oil that had migrated up a vertical section of pipe. In one study the camera proved that an ambient temperature of 77 °F (25°C) meant the gas had exceeded its real dewpoint by at least 3–7 °F, while the analyser still reported –48.5°F (-44.7°C).
Quantifying the benefits
The value proposition of visual monitoring falls into three broad categories:
- Process optimisation – Operators can verify separator efficiency and diagnose faults, detect carry-over from glycol dehydrators or NGL recovery systems, and fine-tune liquid levels in knock-out drums and heater set-points with immediate feedback.
- Asset protection – Early-warning alarms prevent wet-gas erosion of turbine blades, filter bypass in high-liquid events and liquid carryover or even hydrate formation at compressor stations.
- Commercial clarity – With incontrovertible video evidence, custody-transfer disputes over out-of-spec gas are resolved quickly and fairly. Suppliers gain confidence that valuable NGLs are not leaked into the sales gas; buyers avoid paying “dry-gas” prices for wet product.
A complementary, not replacement, metric
None of this means dewpoint should be abandoned. Temperature-pressure phase calculations remain essential for design and planning. What the industry is learning is that the physics involved in two-phase flow in gas pipelines means that dewpoint measurement or calculation alone is not a guarantee of dryness in dynamic, multi-source systems. The pragmatic solution is a dual-validation philosophy: keep dewpoint as a screening tool and overlay it with continuous visual confirmation at critical points—export lines, compressor inlets, custody-transfer skids and LNG feed lines and gas turbine feed gas.
In practice that might look like this:
- If the camera shows a clean, “dry” view, operators run normal dewpoint controls.
- If mist or streaks are detected, an alarm triggers a separator inspection\maintenance is required or, if necessary, temporary flow reduction.
- Visual trends are logged to a secure portal, creating an auditable data trail for maintenance and commercial teams.
Aligning with digital-oilfield strategies
Visual monitoring fits neatly into wider digitalisation efforts sweeping the oil-and-gas sector. Video feeds integrated with SCADA and DCS platforms; AI-driven analytics convert pixels into quantitative KPIs such as liquid volume fraction or contamination events per month. Because LineVu data are time- and location-stamped, they correlate directly with chromatograph peaks, flow-meter upsets or compressor VSD excursions, enriching machine-learning models that aim to predict failures before they happen.
Preparing for a more complex energy mix
As networks blend growing volumes of hydrogen, biomethane and synthetic gas, dewpoint behaviour will become even harder to predict. Hydrogen changes the Joule-Thomson profile; biogas introduces higher-boiling trace species; intermittent reverse-flow alters equilibrium. A technology that can see what phase the gas is in—regardless of composition—offers future-proof assurance.
Conclusion
The industry’s long reliance on hydrocarbon dewpoint made sense when measurement options were limited. Today’s process-imaging technologies expose the metric’s blind spots and provide a practical remedy. Real-time visual monitoring delivers certainty where modelling delivers estimates, turning an invisible threat into a visible, manageable parameter. For operators, that translates into fewer outages, lower maintenance costs and verifiable compliance with contractual quality. For the wider energy transition, it means safer, more efficient infrastructure capable of handling an increasingly diverse gas portfolio. In short, the question is no longer “Can we afford to look inside our pipelines?” but “Can we afford not to?”