


Chemical processing is a particular industry where the full suite of ITS process visualisation technology can be applied virtually across the board. Electrical resistance tomography (ERT), electrical capacitance tomography (ECT), or a combination of the two (aka a dual modality system) have all found an operational home in the chemical industry and associated research.
Electrical tomography’s multivalent monitoring utility extends over four fundamental parameters in the chemical processing sector:
- Mix – to optimise blending and reaction processes for consistent results
- Separation – improving phase separation to facilitate product purity
- Flow – real-time monitoring of fluid behaviour to accurately control chemical processes
- Level – monitoring and controlling interface levels to ensure process stability
Let us consider these four parameters as specifically applied to chemical processing.
Mix
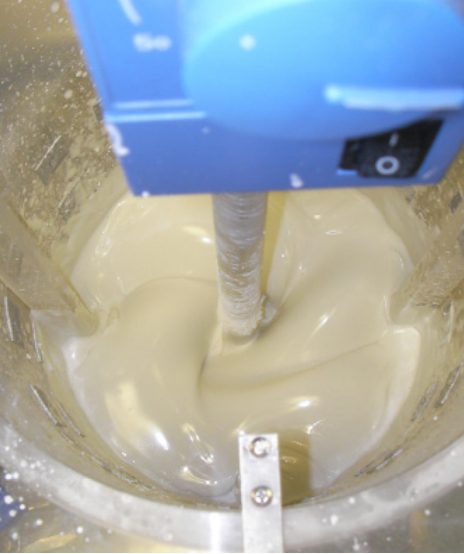
While we discussed mixing in our last publication, linked here, the manufacture of paint and surface coatings is a chemical processing sub-genre where the homogenous mixing of raw ingredients assumes a heightened importance and merits special scrutiny.
Paint is viscid by its very nature, consisting of both liquid and solid components that can be further subdivided into four fundamental components:
- Pigment – which determines colour
- Binder – resin which provides paint with its adhesive qualities while also binding pigments together
- Liquid – water or mineral spirits are used to transport the pigments and binder
- Additives – these are ingredients that cover a wide range of possibilities to improve anything from rust-proofing, algae resistance, to modifying the paint’s rheological properties
ITS devised a trial where a 4-plane sensor array was used to accompany the P2+ Data Acquisition System (DAS) to monitor the mixing of both the “Flat Formula” and the “Concrete Block Formula” – two common surface coating formulae which essentially relate to the permeability of the pre-painted surface.
Electrical resistance tomography (ERT) was able to identify mixing defects, like the formation of caverns or “grottos”, in real-time. Further benefits include reduced mix cycle times by avoiding over mixing, improved product quality by meeting specifications consistently, reduced waste by the accurate determination of measurements of expensive components like pigments, alongside a substantial reduction in energy costs.
Separate
Electrical tomography’s separation credentials are clearly seen in filtration. A process commonly found across the chemical processing industry, liquid-solid filtering processes are fairly ubiquitous with ERT being well suited to monitor this process in real-time.
Given that the purpose of filtration is to isolate a valuable product, either liquid or solid filter cake, ERT has been shown to be a highly effective and cheap monitoring technology to ensure the integrity of both the filtration/separation process and the desired end product.
While there has been a proliferation of chemical processing ERT applications since, the linked study was a very early illustration of ERT’s potential as a filtration monitoring technology. The article is linked here.
A more recent academic study used ERT to monitor a gas-liquid separation process. Electrical tomography’s multivalence is further illustrated since ERT was used to monitor flow as well – the next tomography topic for discussion. The paper can be accessed here.
Flow
Electrical tomography has proven to be highly successful in a range of applications to monitor and visualise flow. However, non-invasive monitoring of multiphase flows is an especially challenging application for most technologies on account of the fact that “non-invasive” and “monitoring” tend to be mutually exclusive terms in technological terms.
For example, monitoring an oil-water-air multiphase flow is even a challenge for electrical tomography because of the contrasting electrical properties of this tripartite mixture. This necessitates the use of both ERT and electrical capacitance tomography (ECT) in a dual modality system.
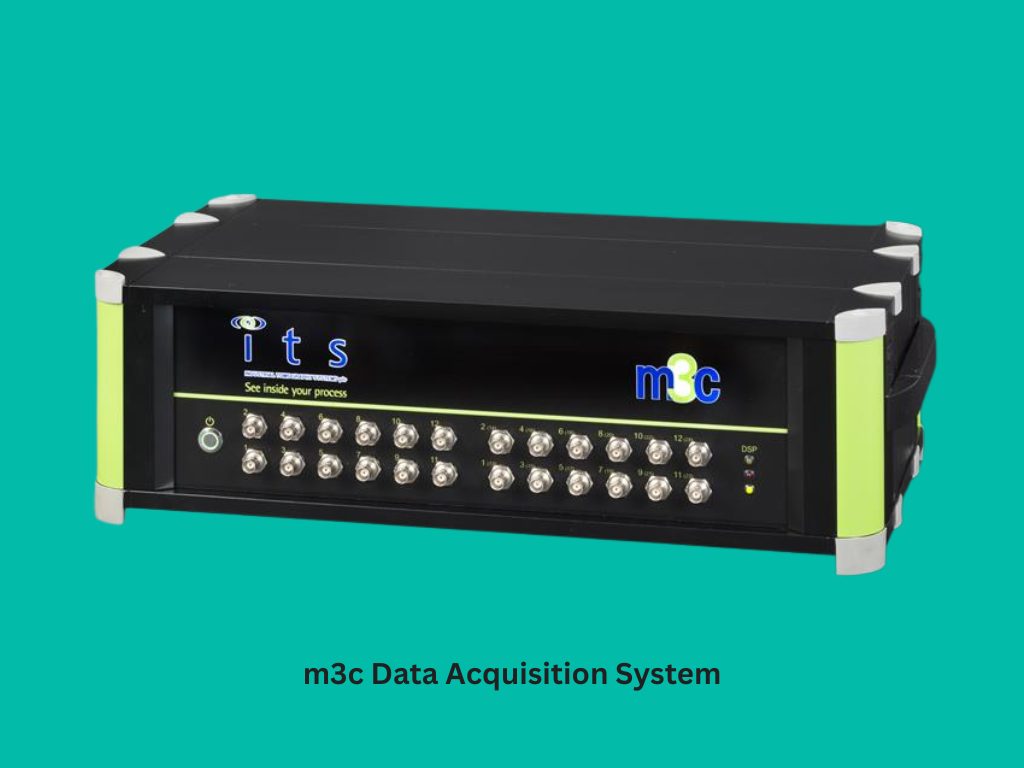
So what is a dual modality system? For ITS, it means a combining two data acquisition systems (DAS) as follows:
- m3c Data Acquisition System – the m3c’ is a dedicated electrical capacitance tomography (ECT) system. Measuring permittivity or capacitance, the m3c is geared towards monitoring air, oil, or powder through a maximum of 24 electrodes arranged in 1-3 sensor planes and allows for ex post data analysis.
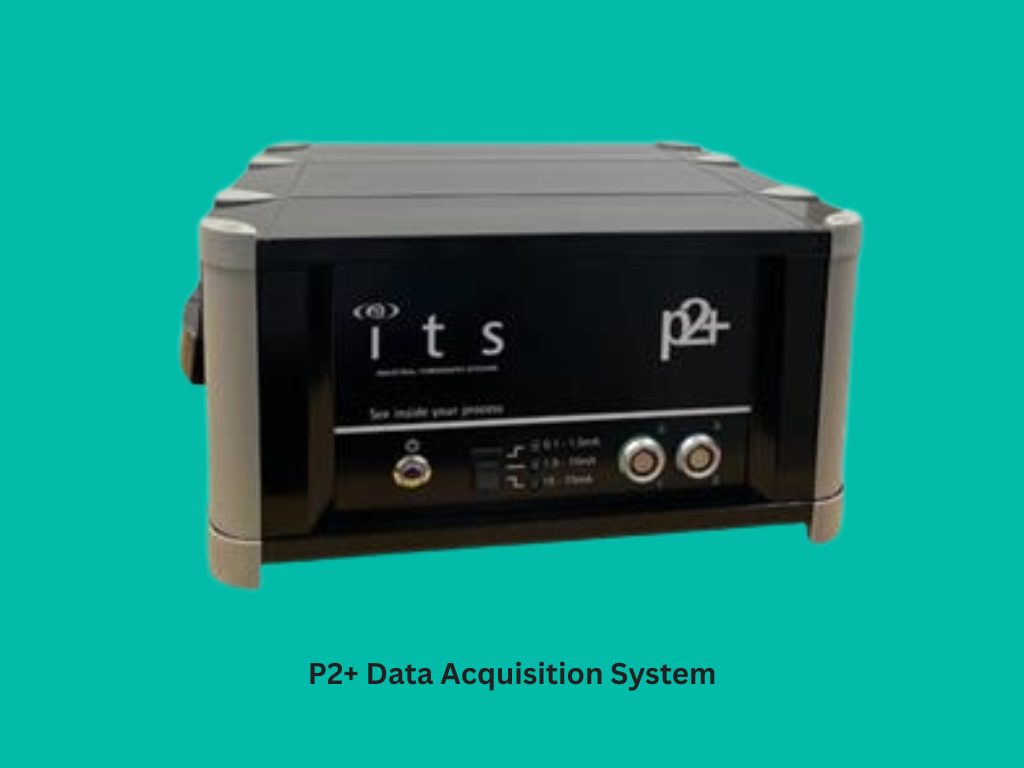
- P2+ Data Acquisition System – an ITS workhorse used in academia and industry throughout the world, the P2+’ is an electrical resistance tomography (ERT) system to measure conductivity, as opposed to capacitance. The P2+’ can accommodate up to 8 sensor planes and allows post processing data analysis.
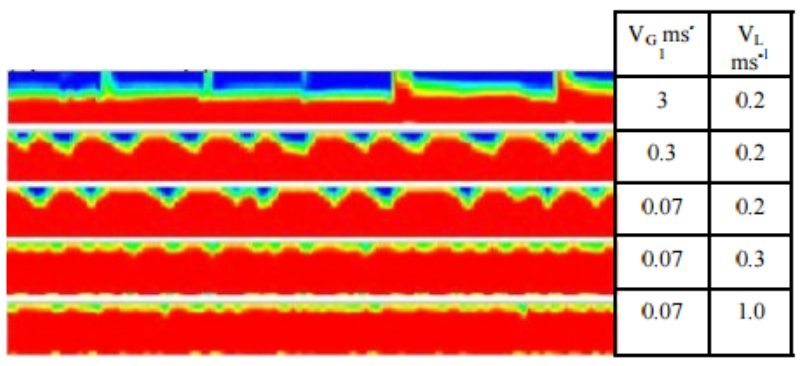
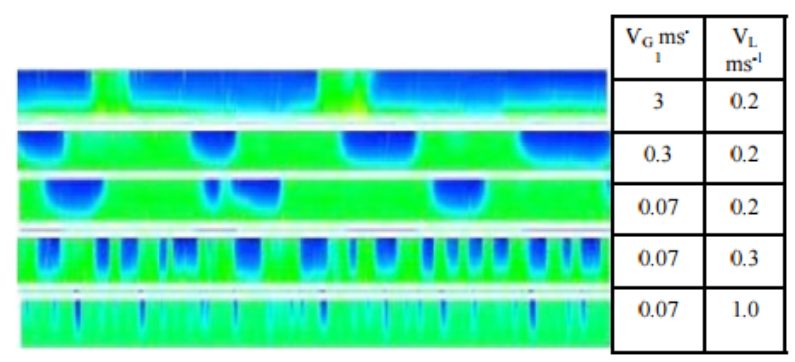
Used as a dual modality system, the m3c’ and the P2+’ have all bases covered as illustrated in the tomograms below of an oil-gas-air multiphase flow. Green/blue is an ERT tomogram with green representing water’s higher conductivity. Red/blue is an ECT tomogram with red representing the greater permittivity or capacitance of oil. The blue represents gas in both tomograms.
Level
While the topic of level and interface detection was broadly covered in a previous article on 4 September 2025 linked here. It is worth reminding ourselves of a couple of key points as applied to chemical processing. ITS sensors can be manufactured to fit virtually any conceivable conduit or container commonly found in the chemical processing industry to measure and monitor the level of any fluid-fluid, fluid-foam, or fluid-solid interaction or interface.
Unlike other technologies, electrical tomography is able to distinguish and differentiate between the constituent parts of a two-phase or multiphase flow; well beyond measuring the aggregate level either through the use of ERT, ECT, or a dual modality system.
Conclusion
As can be seen, electrical tomography has a very wide range of applications in the chemical processing industry. Electrical tomography’s ability to monitor a wide range of operational parameters is both limitless and by no means mutually exclusive. ERT or ECT sensors can be repurposed to measure several things simultaneously like monitoring mixing and level or separation and flow – or any other combination – at the same time through the modular design of the ITS computer interface.