

In many applications in the food and beverage industry, turbidity measurement is the most suitable in-line analysis technique for differentiating fluids in the process.
Since fat particles behave the same as solid particles or other turbidity-causing substances during turbidity measurement, dairy products can also be differentiated with the utmost accuracy.
In a new whitepaper “Turbidity control in food and beverage production –
Overview, applications and selection criteria“, the experts from Anderson-Negele discuss the advantages and possibilities of turbidity control for the following applications:
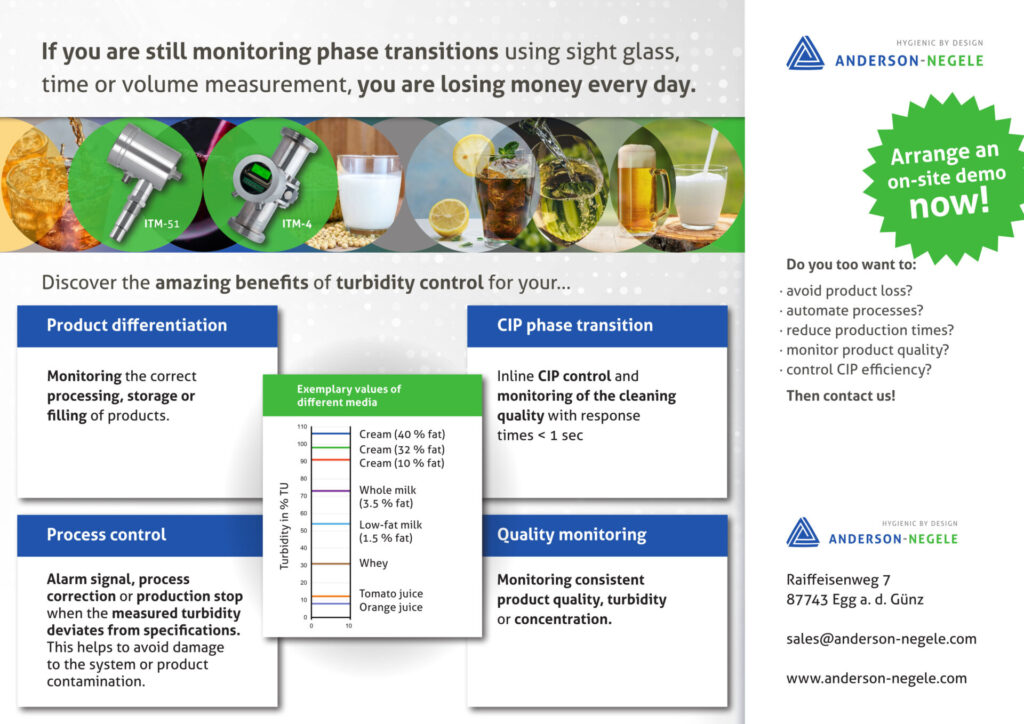
- Product differentiation: Monitoring the correct processing, storage or filling of products.
- CIP phase transition: Inline CIP control and monitoring of the cleaning quality with response times < 1 sec.
- Process control: Alarm signal, process correction or production stop when the measured turbidity deviates from specifications. This helps to avoid damage to the system or product contamination.
- Quality monitoring: Monitoring consistent product quality, turbidity or concentration.
The document also provides an overview of the technologies which are available on the market, a matrix with all possible applications and the recommended technology for each, and a variety of real case examples of how these applications have been successfully implemented by dairies, breweries or the beverage industry worldwide.
Methods for monitoring phase transition
In many production and CIP processes, an optimal phase transition can be crucial for the quality of the end product, the efficiency of the process and the costs of resource losses.
Time-controlled phase change:
This is the classic technique for certain applications such as CIP cleaning. However, a safety buffer of several seconds must be considered to ensure that the wrong product or cleaning agent does not enter the product tanks. As a result, many liters of valuable product or cleaning agent are lost in the wastewater with every phase change.
Visual inspection / laboratory samples:
Manual sampling or monitoring through a sight glass are still frequently used. However, experience shows that both methods result in high personnel costs and quality inconsistencies between samples.
Advantages of turbidity control:
Turbidity meters can monitor liquids for qualitative criteria in real time and with a very high degree of accuracy. This inline analysis makes it possible to automatically adjust the processes in many production plants and application areas in a matter of seconds. This avoids the loss of resources due to incorrect or delayed discharge of media, and also reduces personnel costs for visual or manual control, thus saving money. In many field applications, the use of an Anderson-Negele turbidity sensor has paid for itself in a very short time.
How inline turbidity control works:
Turbidity-causing substances such as solids, fat particles or gas bubbles in the flowing liquid reflect light beams. Using a light source and a light receiver in the sensor, the size, quantity and concentration of the turbidity-causing substances in the flowing liquid can be accurately detected.
Two different measuring techniques of Anderson-Negele’s ITM series offer a suitable solution for every degree of turbidity from 0…300 000 NTU (0…75 000 EBC):
Relative turbidity measurement:
The main advantages of this measurement technology, which is based on the backscattered light method, are the flush installation of the sensor in the process and the affordable price. With a wide selection of process adaptations, the ITM-51 can also be easily integrated into existing pipes from DN25 in compliance with internationally recognized hygiene guidelines such as 3-A and EHEDG.
Four-beam turbidity measurement:
The ITM-4 and ITM-4DW (for drinking water) use the 4-beam alternating light method or the transmitted / scattered light method at 90° and 180° for turbidity control. With its measuring ranges starting from 0…5 NTU (0…1 EBC), even the smallest changes in turbidity are detected and output.
ROI calculator for the use of turbidity meters
Is it worth installing a turbidity meter financially? You can calculate this here with just a few clicks. By using inline turbidity analysis, you can save time and resources compared to time-based control or visual monitoring at each phase change. Our ROI calculator provides a rough estimate of how quickly the installation of a turbidity sensor will pay for itself through savings in product costs alone.